
Police recorded 246 shoplifting offences in Leamington from March to July, up from 143 a year earlier. In Leamington South they rose from 42 to 141.
Shoplifting in Leamington has risen by almost three quarters in a year. Police recorded 246 shoplifting offences across the town’s three police neighbourhoods between March and July 2026. In the same five months of 2025 the figure was 143.
Most of the rise is in one place. In the Leamington South neighbourhood, shoplifting more than trebled, from 42 offences to 141.
The figures come from the street-level records Warwickshire Police publishes on data.police.uk. We pulled them for the force’s own neighbourhood boundaries: Leamington Town Centre, Leamington North and Leamington South. July 2026 is the latest month published.
What changed in Leamington
Recorded crime and anti-social behaviour across the three Leamington neighbourhoods rose by 13%, from 2,048 incidents to 2,309. Shoplifting accounts for 103 of those 261 extra records.
| Category | March to July 2025 | March to July 2026 | Change |
|---|---|---|---|
| Violence and sexual offences | 652 | 734 | +82 |
| Anti-social behaviour | 409 | 480 | +71 |
| Shoplifting | 143 | 246 | +103 |
| Criminal damage and arson | 147 | 166 | +19 |
| Vehicle crime | 188 | 123 | -65 |
| Bicycle theft | 23 | 53 | +30 |
| All categories | 2,048 | 2,309 | +261 |
The table shows the categories that moved most. The all-categories row includes the others too, such as burglary, public order and drugs offences.
Three things stand out:
- Shoplifting is up 72%, from 143 offences to 246.
- Bicycle theft has more than doubled, from 23 to 53.
- Vehicle crime is down by about a third, from 188 to 123. That is the one clear improvement in the figures.
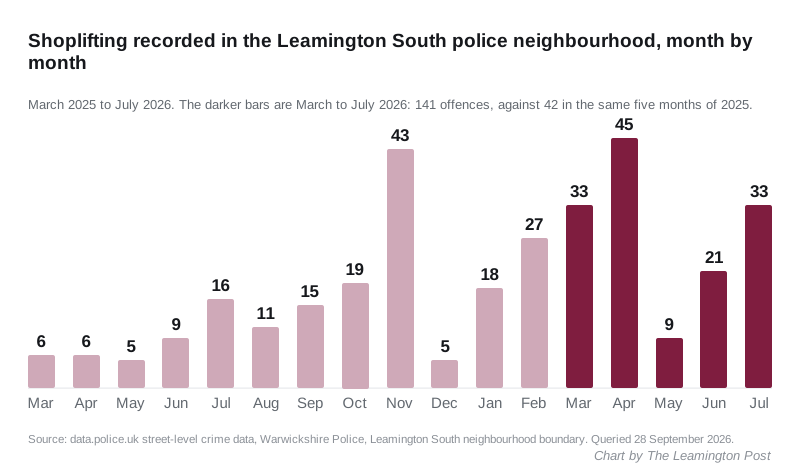
Leamington South
Leamington South takes in Radford Road, Tachbrook Road and Sydenham. Its total for all crime and anti-social behaviour rose by 24%, from 773 to 958.
July 2026 was its busiest month of the 17 we examined, with 238 records. The previous high was 203, in April 2026.
Shoplifting drove much of that. The monthly count has run higher since last autumn. It reached 43 in November 2025 and 45 in April 2026, against single figures in most months of spring 2025.
Police.uk places each record at an approximate point, “on or near” a street or a type of place, to protect the people involved. So a location shows where records cluster, not the exact shop.
Even so, one point dominates. Of the 141 shoplifting offences this spring and summer, 95 were mapped on or near St Mary’s Terrace, in Sydenham. In March to July 2025 that point had just 2.
What happened to the cases
Police.uk also records where each case has got to. For the 141 shoplifting offences in Leamington South from March to July 2026:
| Outcome so far | Offences |
|---|---|
| Awaiting court outcome | 58 |
| Investigation complete, no suspect identified | 51 |
| Unable to prosecute suspect | 17 |
| Under investigation | 13 |
| Offender given a caution | 1 |
| Status update unavailable | 1 |
So 58 of the offences, about four in ten, have reached the point where a suspect has been charged and the case is waiting for court. It does not tell you how many people are involved, and we have not tried to guess.
Warwick, Kenilworth and Whitnash
The picture is mixed across the rest of the district’s towns.
| Neighbourhood | March to July 2025 | March to July 2026 | Change |
|---|---|---|---|
| Leamington South | 773 | 958 | +24% |
| Kenilworth | 557 | 628 | +13% |
| Leamington Town Centre | 472 | 526 | +11% |
| Whitnash | 179 | 189 | +6% |
| Leamington North | 803 | 825 | +3% |
| Warwick Central | 1,826 | 1,706 | -7% |
Warwick Central, which takes in Warwick town, is the one neighbourhood where the total fell. Anti-social behaviour there dropped from 455 incidents to 355.
In Kenilworth, anti-social behaviour went the other way, from 112 to 140.
What the figures can and cannot tell you
These are recorded incidents, not a measure of how safe a street feels. A rise in shoplifting can mean more thefts. It can also mean shops reported more of them, or police recorded more. Shoplifting counts are especially sensitive to how often retailers call the police.
Anti-social behaviour is counted alongside crime on police.uk, but it is not all criminal. We have kept it in the totals because it is a large share of what residents report.
We used the same force boundaries for every month, so the comparison is like for like. The figures can move slightly if the force revises its records.
What it means for you
- If you run a shop, report every theft, even small ones. Recorded reports are what show up in these figures and what shape where patrols go. Warwickshire Police takes reports online or on 101. Call 999 if a crime is happening now.
- If you cycle into town, lock the frame, not just a wheel. Bike thefts in Leamington more than doubled this spring and summer.
- New street rules start on 4 November. The district’s renewed Public Spaces Protection Orders take effect then. We covered what the new orders include.
- Check your own street by searching your postcode on police.uk.
We will update this when the August figures are published.
Sources
- data.police.uk street-level crime data, Warwickshire Police, for every monthly total, category, location and outcome in this article. Queried on 28 September 2026 for March 2025 to July 2026 using the force’s boundaries for the Leamington Town Centre, Leamington North, Leamington South, Whitnash, Warwick Central and Kenilworth neighbourhoods.
- Report a crime, Warwickshire Police.
Have your say