
The average Warwick district home sold for £366,942 in May 2026, up 3.4% in a year. Prices by property type, and how Leamington, Warwick and Kenilworth compare.
What a Leamington house is worth depends entirely on which number you are reading. Asking prices in agents’ windows are hopes. The figure that counts is what buyers actually paid, which HM Land Registry records once each sale completes. This page reads those sold-price figures plainly: the district average, what each property type goes for, how many homes are actually changing hands, and where Leamington sits against Warwick and Kenilworth.
The quick answer
The average home in Warwick district sold for £366,942 in May 2026, according to the UK House Price Index, which is built from completed Land Registry sales rather than asking prices. That is up 3.4% over twelve months, comfortably ahead of England’s 2.3% and of Warwickshire’s 2.2%.
The district covers Royal Leamington Spa, Warwick, Kenilworth, Whitnash and the villages between them, so it blends three quite different markets. On a rolling-year basis, Rightmove’s sold-price records put the Leamington Spa town average at £384,429, above the district figure. Both numbers are real. They cover different areas over different windows, so always check which is which before comparing.
One caveat worth holding on to: the district average slipped 1.8% in the single month to May 2026 even as the annual figure rose. Month-to-month movement in a district this size is noise, driven by which homes happened to complete. The twelve-month direction is the signal.
What it means for you
If you are selling, the constraint is volume rather than price. Warwick district recorded 142 sales in March 2026, the most recent month with a confirmed count, against 116 in February and 164 in December. That is a market that is functioning but thin, and Rightmove’s rolling-year town figures for Leamington, Warwick and Kenilworth are all down between 2% and 6% on the previous year even while the official index is up. Read that gap as pricing discipline: realistic asking prices sell, ambitious ones sit.
If you are buying, the 3.4% annual rise means waiting is not free, but neither is it a stampede. Flats are the one soft category, up just 0.6% over the year, which makes the entry rung of the ladder the most negotiable part of the market. It is worth checking the running costs of anything you view, including the station car park charges if you plan to commute, before you fix on the asking price.
If you are staying put, your home has gained roughly 3 to 5% in a year depending on what it is, and the semi-detached houses that make up most of Whitnash, Lillington and Sydenham have done best of all.
Prices by property type
The headline average hides a spread of more than £430,000 between the top and bottom rungs. These are the Warwick district averages for May 2026 from the UK House Price Index:
- Detached houses: £648,029, up 3.5% on the year. The Kenilworth Road and Milverton end of the market, plus the villages.
- Semi-detached houses: £386,532, up 4.6%, the fastest riser of the four. The standard Whitnash, Lillington and Sydenham family home.
- Terraced houses: £320,399, up 4.0%. Everything from Regency terraces off the Parade to the Victorian streets south of the river.
- Flats and maisonettes: £213,770, up just 0.6%, the clear laggard.
A first-time buyer in the district paid an average of £301,690 in May 2026, up 3.3% on the year. A home mover, someone selling one property to buy another, paid £441,502. The roughly £140,000 gap between those two figures is the size of the step from a first flat or terrace to a family house here.
New build is its own market. In March 2026 a new home in the district averaged £518,373 against £364,619 for an existing property, a premium of more than 40%. Buyers paying cash averaged £350,571; those buying with a mortgage averaged £381,517.
Leamington, Warwick or Kenilworth?
Three towns, one district, and a clear pecking order. Kenilworth is the expensive one, Leamington sits in the middle, and Warwick has fallen furthest over the past year.
Kenilworth is the priciest of the three at £445,159 over the rolling year, with detached homes averaging £610,092 and semis £459,720. Notably, its terraced average of £321,594 is the lowest of the three towns, so the premium sits almost entirely in the larger houses.
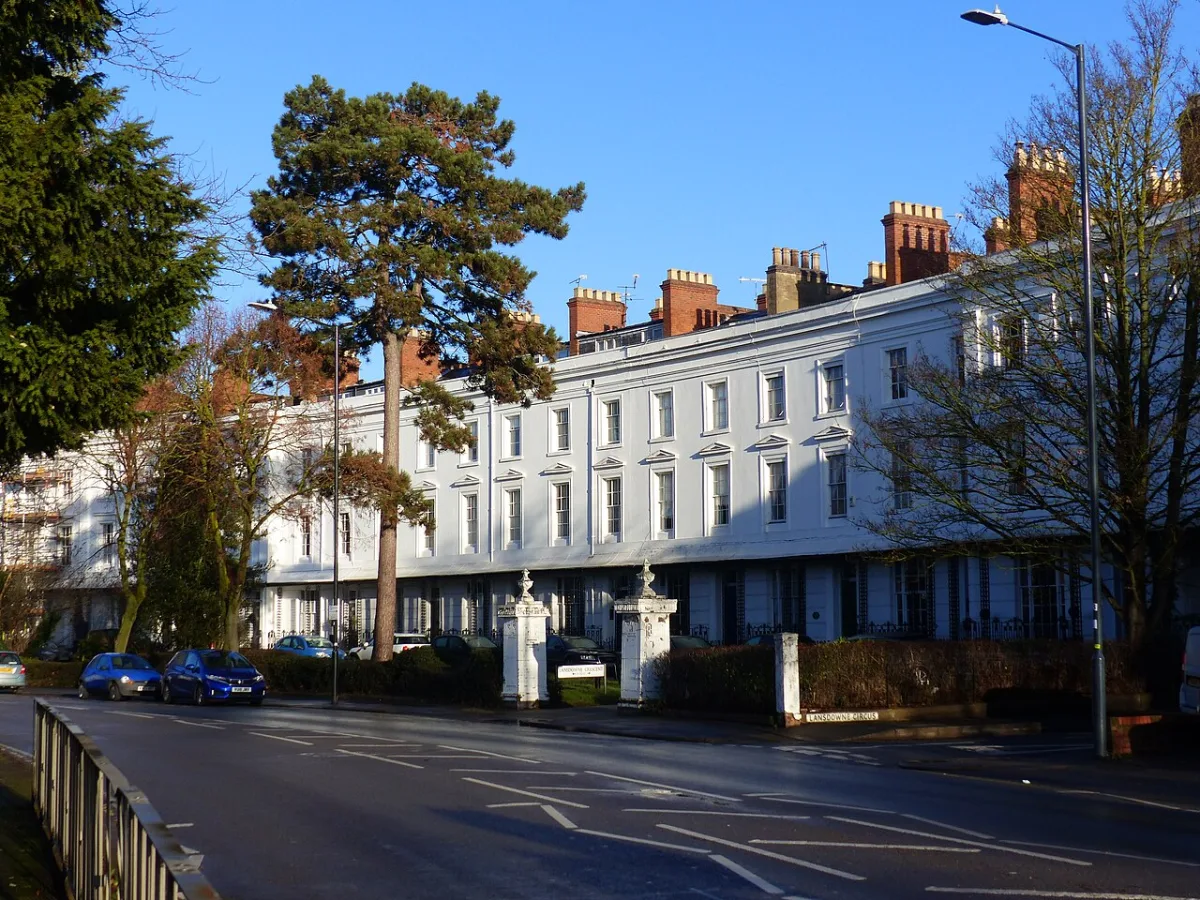
Leamington Spa averages £384,429. Its terraced figure of £391,960 is unusual: it is higher than Warwick’s detached-to-terraced spread would suggest, and it reflects the town’s stock of large Regency and Victorian terraces off the Parade and around Clarendon Square, which are family houses rather than starter homes. Leamington flats average £242,913.
Warwick averages £372,968 and has had the softest year of the three, down 6% and 4% below its 2023 peak of £389,923.
| Area | Average price | Annual change | Basis |
|---|---|---|---|
| Kenilworth | £445,159 | -3% | Rolling year, town |
| Leamington Spa | £384,429 | -2% | Rolling year, town |
| Warwick | £372,968 | -6% | Rolling year, town |
| Warwick district | £366,942 | +3.4% | UK HPI, May 2026 |
| Warwickshire | £305,609 | +2.2% | UK HPI, May 2026 |
| England | £292,095 | +2.3% | UK HPI, May 2026 |
| West Midlands | £233,957 | +2.2% | UK HPI, May 2026 |
The two bases disagree on direction, and that is worth understanding rather than smoothing over. The official index compares like-for-like properties month by month and says the district is up 3.4%. The rolling-year town averages simply average whatever sold, so they fall when the mix shifts toward smaller homes, which is what a thin market with few large-house sales produces. Taken together: underlying values are holding and rising modestly, while the type of home changing hands has got smaller.
Why Warwick district costs more than Warwickshire
The district average is £61,333 above the Warwickshire average and about £75,000 above England. Three things hold it there.
The first is London reach without London prices. Leamington Spa has a direct Chiltern Railways service to London Marylebone in about 1 hour 22 minutes, which puts the town inside a commuting radius that most of the West Midlands cannot claim. Details are on our Leamington train times to London page.
The second is amenity and employment. Much of what buyers are paying for is walkable: the Regency parks, the free museum and the rest of the things to do in and around the town. The district also sits between the University of Warwick, Jaguar Land Rover’s Gaydon and Whitley sites and Leamington’s own cluster of video-game studios, which is large enough that the town is routinely called Silicon Spa.
The third is constrained supply. Much of the land around Leamington and Kenilworth is West Midlands Green Belt, and releasing it is precisely what the current South Warwickshire Local Plan proposes to do, with 3,472 homes earmarked for three sites on Leamington’s northern and eastern edges. If that plan is found sound, the supply picture here changes materially from the early 2030s.
Frequently asked questions
What is the average house price in Leamington Spa?
The Warwick district average, which includes Leamington, was £366,942 in May 2026 on the official UK House Price Index. For the town itself, Rightmove’s rolling-year sold prices give £384,429. The district figure is the more reliable measure of movement; the town figure is the better guide to what a Leamington address costs.
Are Leamington house prices going up or down in 2026?
Up on the official measure. Warwick district prices rose 3.4% in the year to May 2026, ahead of England at 2.3%. Rolling-year town averages are down slightly, which reflects a shift toward smaller homes selling rather than falling values.
How much is a detached house in Warwick district?
A detached house averaged £648,029 in May 2026, up 3.5% on the year, and roughly 1.7 times the price of the average semi-detached home in the district.
Which is more expensive, Leamington or Kenilworth?
Kenilworth, by around £60,000 on rolling-year town averages: £445,159 against Leamington’s £384,429. The gap is concentrated in larger houses; Kenilworth’s average terraced price is actually the lowest of the three towns.
How many homes are actually selling?
Warwick district recorded 142 completed sales in March 2026, the most recent month with a confirmed volume, against 116 in February and 164 in December 2025. Sales volumes are always the last figure to firm up because they depend on registrations.
Where can I check what a specific house sold for?
Every completed sale in England and Wales is public. Look up any street or address free on the HM Land Registry Price Paid service, or browse the same data on Rightmove and Zoopla.
Sources
- UK House Price Index, Warwick district (ONS / HM Land Registry) for the district average, property-type, buyer-type and annual-change figures.
- HM Land Registry UKHPI open data for the May 2026 Warwick district figures, and the matching Warwickshire, West Midlands and England records used as benchmarks, plus the March 2026 sales volume and new-build, cash and mortgage averages.
- Rightmove sold-price pages for Leamington Spa, Warwick and Kenilworth for rolling-year town averages and by-type breakdowns.
- HM Land Registry Price Paid search to check any individual address.
Figures are provisional and revised as more sales complete. Monthly index figures and rolling-year town averages cover different areas and periods, so they are not directly comparable. Always confirm the latest numbers against the linked HM Land Registry sources before making a decision. Checked August 2026.
Have your say