
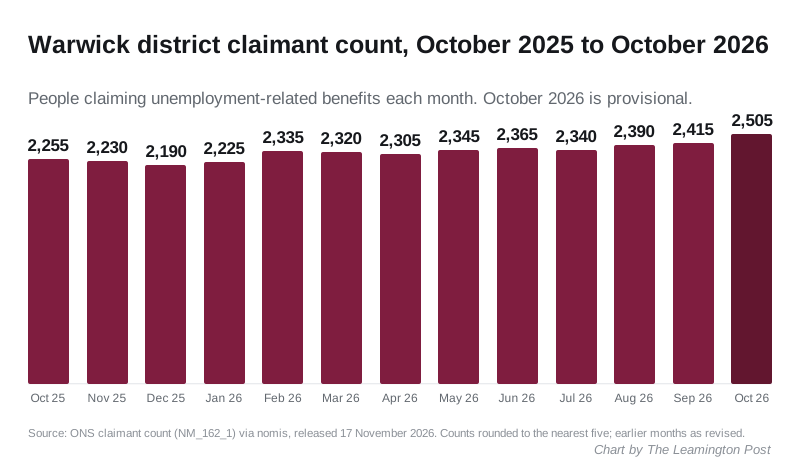
2,505 people in Warwick district claimed jobless benefits in October, up 90 in a month and 250 in a year. The rise is three times the UK's.
2,505 people in Warwick district were claiming unemployment-related benefits in October. That is 90 more than in September and 250 more than in October last year.
The district’s count rose by 11.1% over the year. Across the UK the rise was 3.5%.
The figures are the ONS claimant count for October 2026, published on 17 November and taken from nomis. October’s figure is provisional. If it holds, it is the highest monthly count in the district since October 2021, when it was 2,575.
The key numbers
- 2,505 claimants, 2.6% of residents aged 16 to 64
- Up 90 in a month (3.7%), against 2.1% across the UK
- Up 250 in a year (11.1%), against 3.5% across the UK
- 520 claimants aged 18 to 24, up 95 in a year and the most since June 2021
- 625 claimants aged 50 and over, up 105 in a year
Older claimants are rising as fast as the young
For most of this year the rise came from 18 to 24 year olds. We reported that in September, when they made up six in every ten of the extra claimants.
October’s figures spread the rise more widely. Claimants aged 50 and over went up by 105 in a year, more than the 95 among 18 to 24 year olds.
| Age | October 2025 | October 2026 | Change |
|---|---|---|---|
| 18 to 24 | 425 | 520 | +95 |
| 25 to 29 | 255 | 270 | +15 |
| 30 to 34 | 240 | 265 | +25 |
| 35 to 39 | 315 | 295 | -20 |
| 40 to 44 | 290 | 290 | 0 |
| 45 to 49 | 215 | 230 | +15 |
| 50 to 54 | 185 | 210 | +25 |
| 55 to 59 | 160 | 195 | +35 |
| 60 to 64 | 140 | 165 | +25 |
| 65 and over | 35 | 55 | +20 |
The age bands are each rounded to the nearest five, so they do not add exactly to the district total.
How Warwick district compares with the rest of Warwickshire
Over the year, only North Warwickshire rose faster than Warwick district.
| District | October 2025 | October 2026 | Change | Rate |
|---|---|---|---|---|
| North Warwickshire | 1,070 | 1,250 | +16.8% | 3.1% |
| Warwick | 2,255 | 2,505 | +11.1% | 2.6% |
| Rugby | 2,065 | 2,250 | +9.0% | 2.9% |
| Stratford-on-Avon | 1,705 | 1,850 | +8.5% | 2.2% |
| Nuneaton and Bedworth | 3,605 | 3,760 | +4.3% | 4.3% |
| Warwickshire | 10,700 | 11,610 | +8.5% | 3.0% |
| United Kingdom | 1,650,220 | 1,707,320 | +3.5% | 3.9% |
The district’s rate is still lower than most places. It is below Warwickshire’s 3.0%, the West Midlands’ 5.4% and the UK’s 3.9%. Only Stratford-on-Avon is lower in the county.
Where claimants live
Rates across the district’s 17 wards run from 3.9% down to 1.4%. The six highest are all in Leamington and Warwick:
- Leamington Brunswick: 3.9% (305 claimants)
- Warwick Aylesford: 3.5% (155)
- Leamington Clarendon: 3.1% (250)
- Warwick All Saints and Woodloes: 3.1% (180)
- Leamington Lillington: 2.8% (205)
- Warwick Saltisford: 2.8% (135)
Warwick Aylesford had the biggest jump in a month, from 140 claimants to 155. The lowest rates are in Cubbington and Leek Wootton, at 1.4%, and Kenilworth Abbey and Arden, at 1.5%.
Ward counts are rounded to the nearest five, so the 17 wards add up to 2,510 rather than 2,505.
September’s figure has been revised down
Last month nomis gave September’s district count as 2,455. It now gives 2,415, a downward revision of 40. The September count for 18 to 24 year olds moved from 520 to 505.
The ONS revises the latest month as late claims are processed. A revision the size of September’s would leave October at 2,465. That would still be the highest since October 2021, but only just: November 2021 was 2,460.
What it means for you
The claimant count is not the unemployment rate. It counts people on Jobseeker’s Allowance, plus people on Universal Credit who must look for work to keep the benefit. Some of them work limited hours. Some unemployed people do not claim, so they are not counted. The ONS says the measure does not attempt to measure unemployment.
What it does show is a steady rise in Leamington, Warwick and Kenilworth through 2026, now reaching people over 50 as well as school and college leavers.
- Ward-level figures for your own area are free to look up on nomis, updated monthly.
- The next release is due in December, with November’s figures.
Sources
- ONS claimant count, via nomis, dataset “Claimant count by sex and age” (NM_162_1), for every figure quoted: the Warwick district monthly counts from October 2020 to October 2026, the rate as a share of residents aged 16 to 64, the age breakdown for October 2025 and October 2026, the monthly 18 to 24 counts, the five Warwickshire districts, Warwickshire, the West Midlands and the UK, and the 17 ward counts and rates for September and October 2026. Counts are rounded to the nearest five.
- Labour market overview, UK, Office for National Statistics, for the 17 November 2026 release of the October figures.
- Claimant count methodology, Office for National Statistics, for what the measure includes and why it is not the unemployment rate.
Have your say