
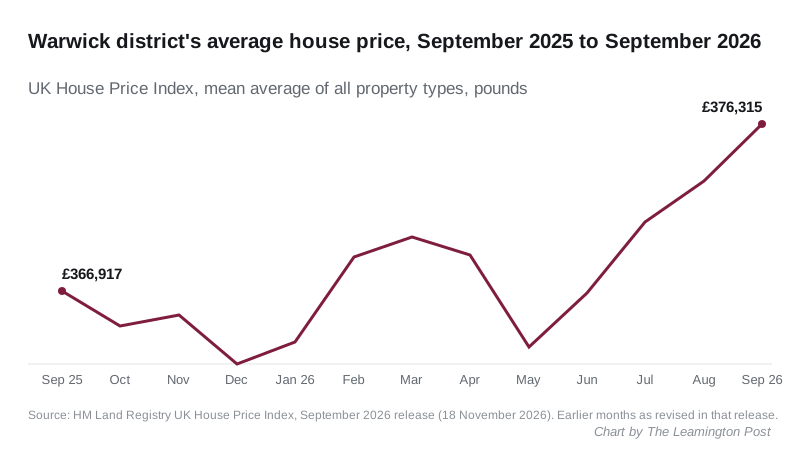
The average Warwick district home cost a record £376,315 in September, up 2.6% in a year. Prices rose 0.9% in the month while England's fell 0.4%.
The average home in Warwick district was worth £376,315 in September 2026. That is the highest figure the official index has recorded for the district.
The figure comes from HM Land Registry’s UK House Price Index, published on 18 November. It is 2.6 per cent higher than a year earlier, a rise of £9,398.
Prices in the district rose 0.9 per cent in the month. Across England the average fell 0.4 per cent, and in Warwickshire as a whole it fell 0.2 per cent.
September is the fourth monthly rise in a row. The run started in June, after a 1.4 per cent drop in May.
A reminder before reading any of this as a valuation: UKHPI figures are mean averages, not medians, so a few large sales pull them up. They cover the whole of Warwick district, which is Leamington Spa, Warwick, Kenilworth, Whitnash and the villages around them.
Every type of home is up, flats only just
| Property type | Average, September 2026 | Change on the year |
|---|---|---|
| Detached | £662,250 | +2.5% |
| Semi-detached | £397,104 | +3.7% |
| Terraced | £330,521 | +3.2% |
| Flat or maisonette | £218,127 | +0.1% |
Semi-detached homes rose fastest. Flats were flat: up 0.1 per cent on the year, after showing an annual fall in July and August.
The first-time buyer average was £309,698, up 2.7 per cent. Home movers, people selling one home to buy another, paid £452,713 on average.
How the district compares
Warwick district is now 79th of the 295 local authority districts in England for annual price growth. A year-on-year fall was recorded in 108 of them.
It is the second-dearest part of Warwickshire, behind Stratford-on-Avon. North Warwickshire is still the county’s fastest riser.
- Stratford-on-Avon: £398,678, up £12,317 (+3.2%)
- Warwick district: £376,315, up £9,398 (+2.6%)
- North Warwickshire: £273,627, up £11,118 (+4.2%)
- Rugby: £276,595, down £5,535 (-2.0%)
- Coventry: £227,043, up £7,583 (+3.5%)
- Nuneaton and Bedworth: £222,531, down £3,381 (-1.5%)
- Warwickshire: £308,647, up £3,346 (+1.1%)
- England: £292,998, up £2,386 (+0.8%)
Rugby and Nuneaton and Bedworth are the only two of the county’s districts where the average is lower than a year ago.
Earlier months have been revised up
UKHPI restates earlier months as more sales are registered, and this release moved the district’s summer figures up.
- August was first published at £370,924, unchanged on the month. It is now £373,106, a rise of 0.6 per cent.
- July is now £370,821. When we reported it in September it was £369,220.
- February, which the July release showed as the district’s highest ever at £371,775, is now £368,812.
That last change matters for our July report, which said July was below the February peak. On the current figures it was not, and that report now carries a note.
Fewer sales than a year ago
The Land Registry publishes sales counts about two months behind prices. Its latest for the district is 157 sales in July 2026, against 216 in July 2025. June had 166.
Five of the first seven months of 2026 recorded fewer sales than the same month in 2025. April and May were busier, but only because spring 2025 was distorted. Buyers rushed to complete before the stamp duty thresholds fell on 1 April 2025, so March 2025 had 416 sales and April 2025 just 87.
What it means for you
If you are selling. The index has risen for four months running, and the summer figures were revised up rather than down. Fewer homes are changing hands than a year ago, though, so the number of buyers looking matters as much as the average.
If you are a first-time buyer. The district’s first-time buyer average, £309,698, is just above the £300,000 point at which first-time buyers in England start paying stamp duty. On the current GOV.UK rates, first-time buyer relief means no tax on the first £300,000 and 5 per cent on the part from £300,001 to £500,000. At exactly that price the bill would be about £485.
If you are buying a flat. Flats have barely moved in a year, at £218,127, against rises of 2.5 to 3.7 per cent for houses.
If you are checking your council tax band. Bands are still based on values at 1 April 1991, so none of this changes yours.
The split by town, with Leamington, Warwick and Kenilworth compared, is on our Leamington house prices page.
Sources
- HM Land Registry UK House Price Index, Warwick district for the £376,315 average, the monthly and annual changes, and the property-type, first-time buyer and home mover averages.
- UK HPI full file, September 2026 release, HM Land Registry, for every month of the district’s series back to January 1995 (which is how the record was checked), the sales counts, the ranking of all 295 English districts and the neighbouring areas’ figures.
- UK HPI full file, August 2026 release, for the August, July and February figures as first published.
- Stamp Duty Land Tax residential rates, GOV.UK for the first-time buyer thresholds.
Figures are HM Land Registry’s for September 2026, published on 18 November 2026. They are provisional and will be revised in later releases.
Have your say