
The average Warwick district home cost £369,220 in July, up just £6,074 in a year. Annual growth more than halved, to the slowest since October 2024.
House price growth in Warwick district more than halved in a single month. The average home was worth £369,220 in July 2026, 1.7 per cent more than a year earlier, according to HM Land Registry’s UK House Price Index.
In June the same measure showed 3.7 per cent. July’s rate is the district’s slowest in 21 months, since October 2024.
In cash, a year added £6,074 to the average Warwick district home. That is about £506 a month. The price is also £197 lower than June, and £2,555 below the February 2026 figure of £371,775, which is the highest the index has ever recorded for the district.
One thing to hold on to before any of the numbers below are read as a valuation: UKHPI averages are mean averages, not medians, so a handful of large sales pull the figure up. The index covers the whole of Warwick district, which is Leamington Spa, Warwick, Kenilworth, Whitnash and the villages between them, not any one street.
Middle of the pack nationally
Of the 295 local authority districts in England, Warwick ranks 153rd for annual price growth in July. That is almost exactly the median. 85 of the 295 fell over the year.
Flats are the only type falling
The slowdown is not evenly spread. Semi-detached homes are still rising at nearly twice the district average, while flats are worth less than they were a year ago.
| Property type | Average, July 2026 | Change on the year |
|---|---|---|
| Detached | £650,692 | +1.6% |
| Semi-detached | £389,160 | +3.0% |
| Terraced | £324,036 | +2.5% |
| Flat or maisonette | £214,223 | -1.1% |
The first-time buyer average across all types is £303,722, up 1.8 per cent on the year.
The neighbours: North Warwickshire is pulling away, Rugby is falling
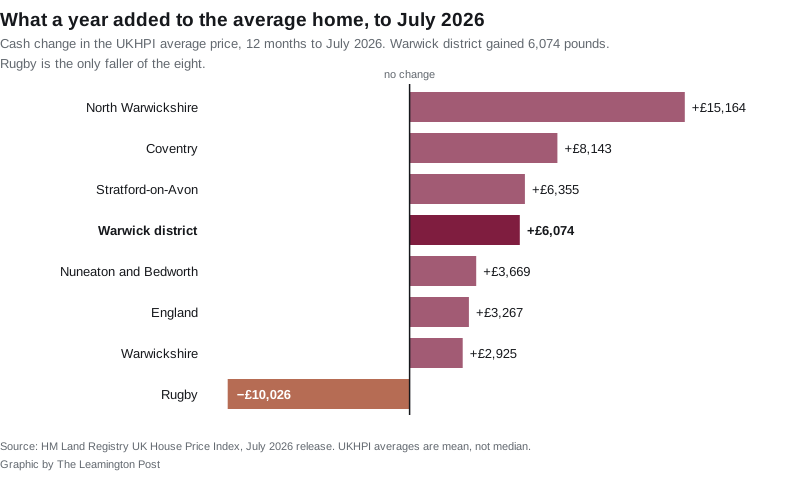
Warwick district still sits above the national and county averages, but it is no longer the county’s fastest riser, which it was in June.
- North Warwickshire: £273,776, up £15,164 (+5.9%), 24th fastest in England
- Coventry: £227,679, up £8,143 (+3.7%)
- Stratford-on-Avon: £396,753, up £6,355 (+1.6%), still the dearest of the group
- Warwick district: £369,220, up £6,074 (+1.7%)
- Nuneaton and Bedworth: £228,142, up £3,669 (+1.6%)
- England: £293,479, up £3,267 (+1.1%)
- Warwickshire as a whole: £307,489, up £2,925 (+1.0%)
- Rugby: £272,696, down £10,026 (-3.5%), 276th of 295 English districts
Rugby is the only faller of the eight. North Warwickshire, which was cheaper than Rugby a year ago, is now dearer.
Sales are thin, and the count lags
The Land Registry publishes sales volumes about three months behind prices. The most recent month it will report for Warwick district is May 2026, with 140 sales. The 2026 run so far is 123 in January, 139 in February, 168 in March, 129 in April and 140 in May. June and July are still blank.
The June figure has been revised down
When we reported the June release at the end of August, the Land Registry gave the Warwick district average as £372,922. In the July release that same month has been revised down to £369,417, a cut of £3,505.
That is normal for UKHPI: it restates earlier months as more sales are registered. It does mean the June number quoted anywhere, including in our own June report, is no longer the figure the Land Registry holds.
What it means for you
If you are selling. The asking-price gap matters more than it did. Prices in the district have gone sideways since February, and the July average is below both June and February. A valuation based on spring comparables may be ahead of the index.
If you are buying a flat. Flats are the one type where the index is below last year, at £214,223. That is 1.1 per cent down over 12 months and 0.2 per cent down on the month.
If you are a first-time buyer. £303,722 is the district’s first-time buyer average. In England, first-time buyers pay no stamp duty on the first £300,000 and 5 per cent on anything between £300,001 and £500,000, and the relief cannot be claimed at all above £500,000. An average-priced purchase here therefore lands just inside the 5 per cent band. Check the actual price against the current thresholds on GOV.UK before budgeting.
If you are checking your council tax band. Bands are still set on values as at 1 April 1991, not on today’s prices, so none of this changes a band. Our Leamington council tax bands page has the current charges.
Longer-term district trends, the split by property type and how Leamington compares with Warwick and Kenilworth are on our Leamington house prices page.
Sources
- HM Land Registry UK House Price Index, Warwick district, July 2026 for the £369,220 average, the 1.7 per cent annual and -0.1 per cent monthly changes, the detached, semi-detached, terraced, flat and first-time buyer averages, and the monthly sales volumes.
- The same index’s monthly figures for Warwick district were read for every month from July 2023 to July 2026, which is how the 21-month comparison and the February 2026 peak were established, and how the revision to the June figure was found.
- UK HPI full file, July 2026 release, HM Land Registry, for the ranking of all 295 English local authority districts and for every neighbouring area’s average and annual change.
- Stamp Duty Land Tax residential rates, GOV.UK for the first-time buyer threshold.
Figures are HM Land Registry’s, published at 9.30am on 16 September 2026 for July 2026. UKHPI averages are mean averages and cover the whole of Warwick district. Checked 21 September 2026.
Have your say